
The Procedure

Signal Acquisition
In the four-minute recording, five electrodes are attached to the body, similar to an ECG.
Quick Results
The recorded parameters are immediately transmitted to the Cardisio server and processed into a report using an AI algorithm.

Consultation with a Doctor
A medical professional will discuss the results with the patient.
The Report
- AI-powered perfusion, structural heart disease, and arrhythmia index
- Representation of heart vectors and their positions in space
- Selected vectorcardiography and ECG parameters
- Presentation of 12-lead ECG, incl. Nehb leads


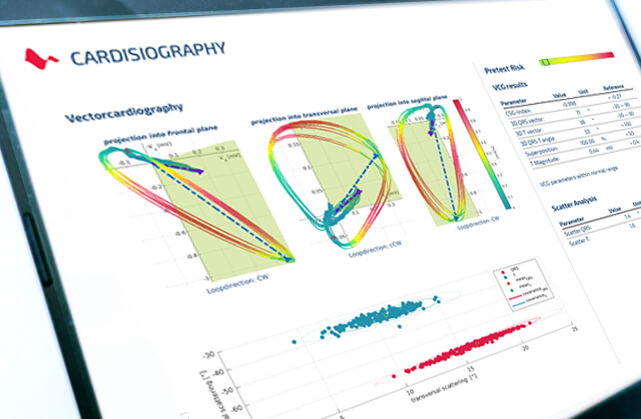
Vectorcardiographic Analysis
This page presents the vector loops in three planes, including color coding for velocity, rotational direction, and block patterns. It also displays the most important vectorcardiographic parameters, including the CSG-Index, which is a strong indicator of ischemic changes. Two critical parameters, Scatter QRS and Scatter T, are shown separately. Pretest risk is indicated if previously specified.
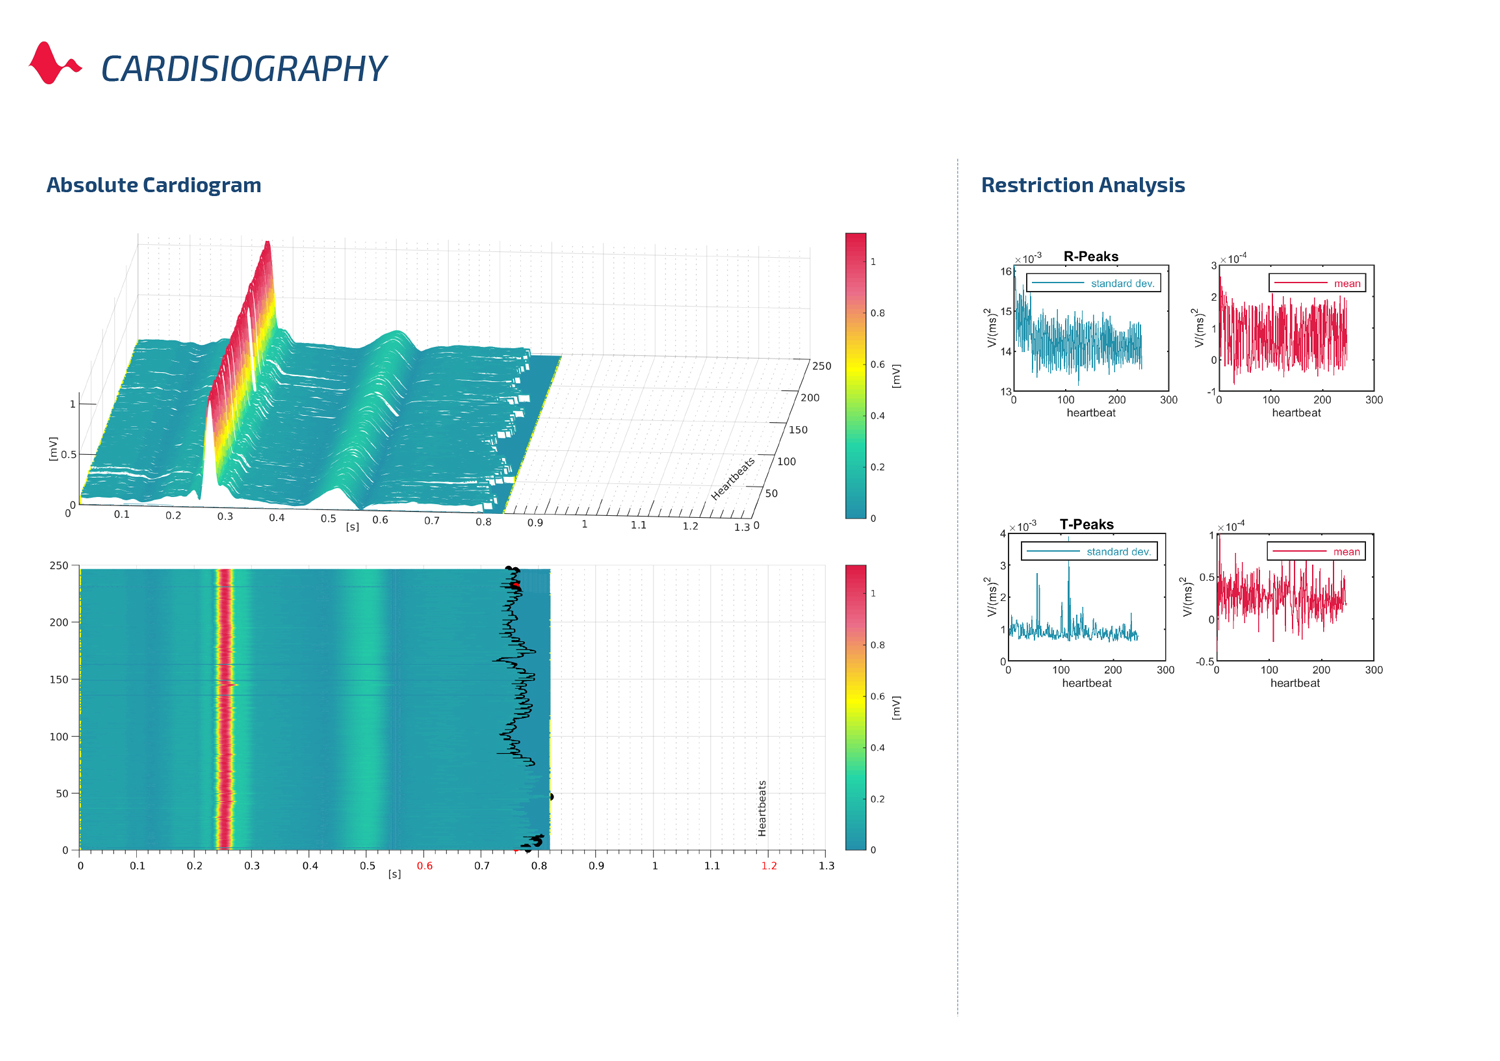
3D Absolute Diagram and Restriction Analysis
This page displays all heartbeats registered during the 4-minute measurement time in the 3D absolute cardiogram. Supraventricular and ventricular extrasystoles, as well as atrial fibrillation and other cardiac arrhythmias, are clearly visible here. Furthermore, it includes an analysis of varying cycle length and heartbeat amplitude.
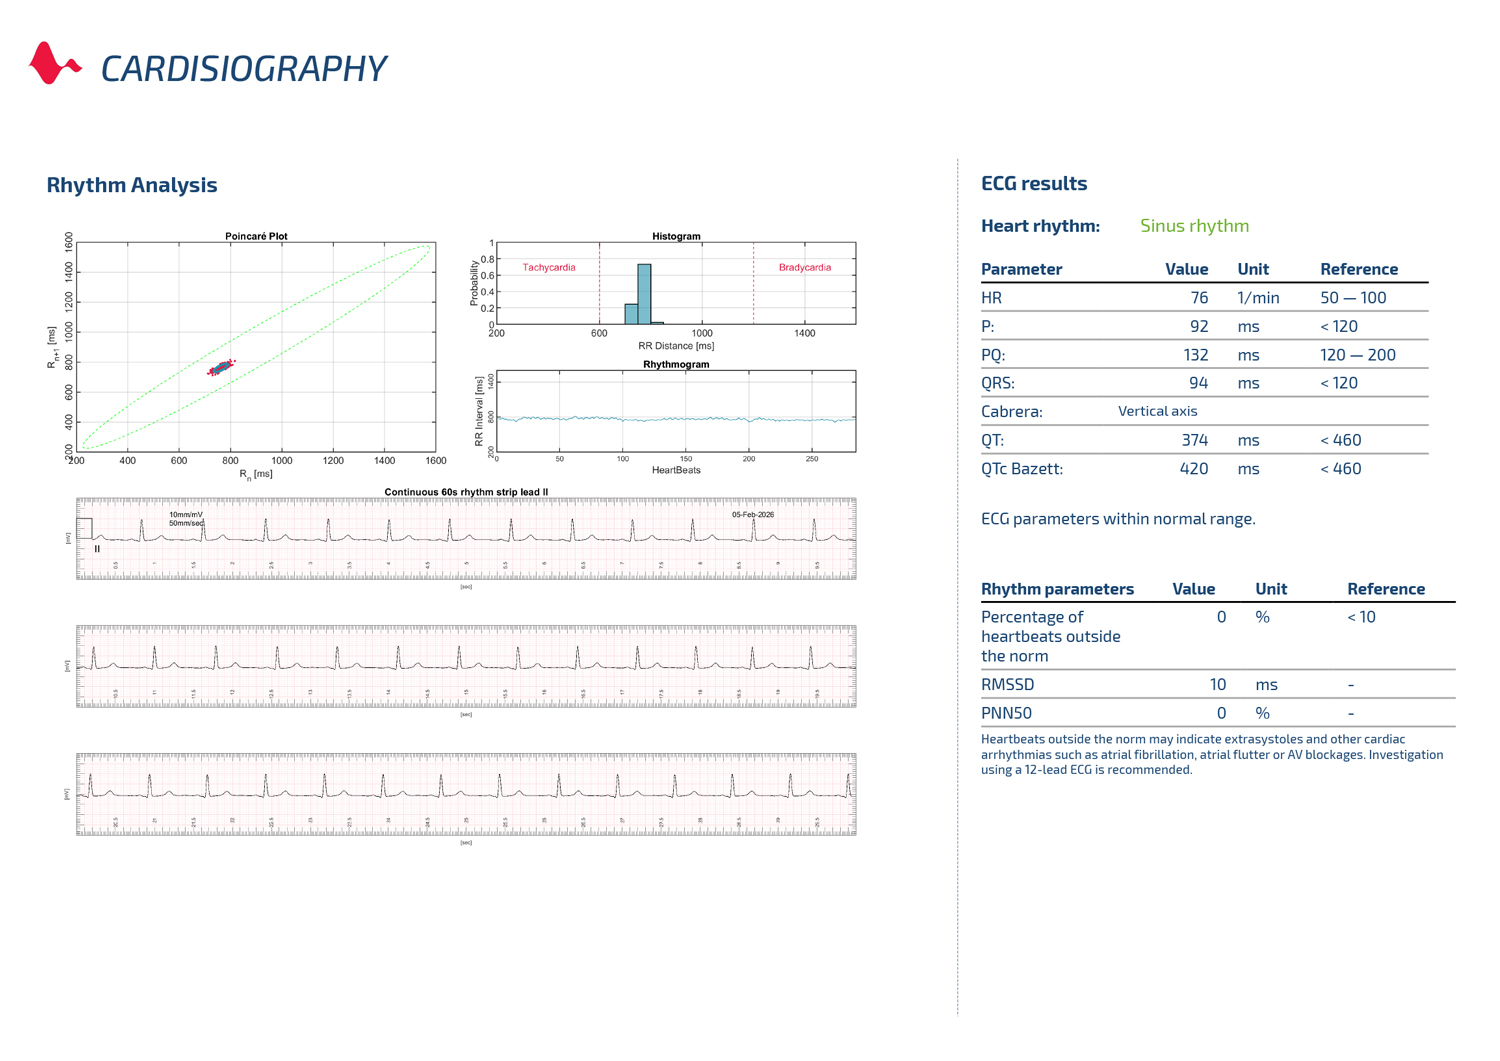
ECG and Rhythm Analysis
All parameters known from conventional ECG systems are listed here and compared against normal values. Deviations are automatically reported.
Additionally, an analysis and automatic output of the heart rhythm are performed.
A rhythm strip evaluates all cardiac arrhythmias over 1 minute. The Poincaré plot evaluates heartbeats outside the expected norm, also clearly highlighting cardiac arrhythmias.
Furthermore, the percentage of heartbeats outside the norm is indicated. This function can be used to analyze which patients would benefit from a Holter monitor.
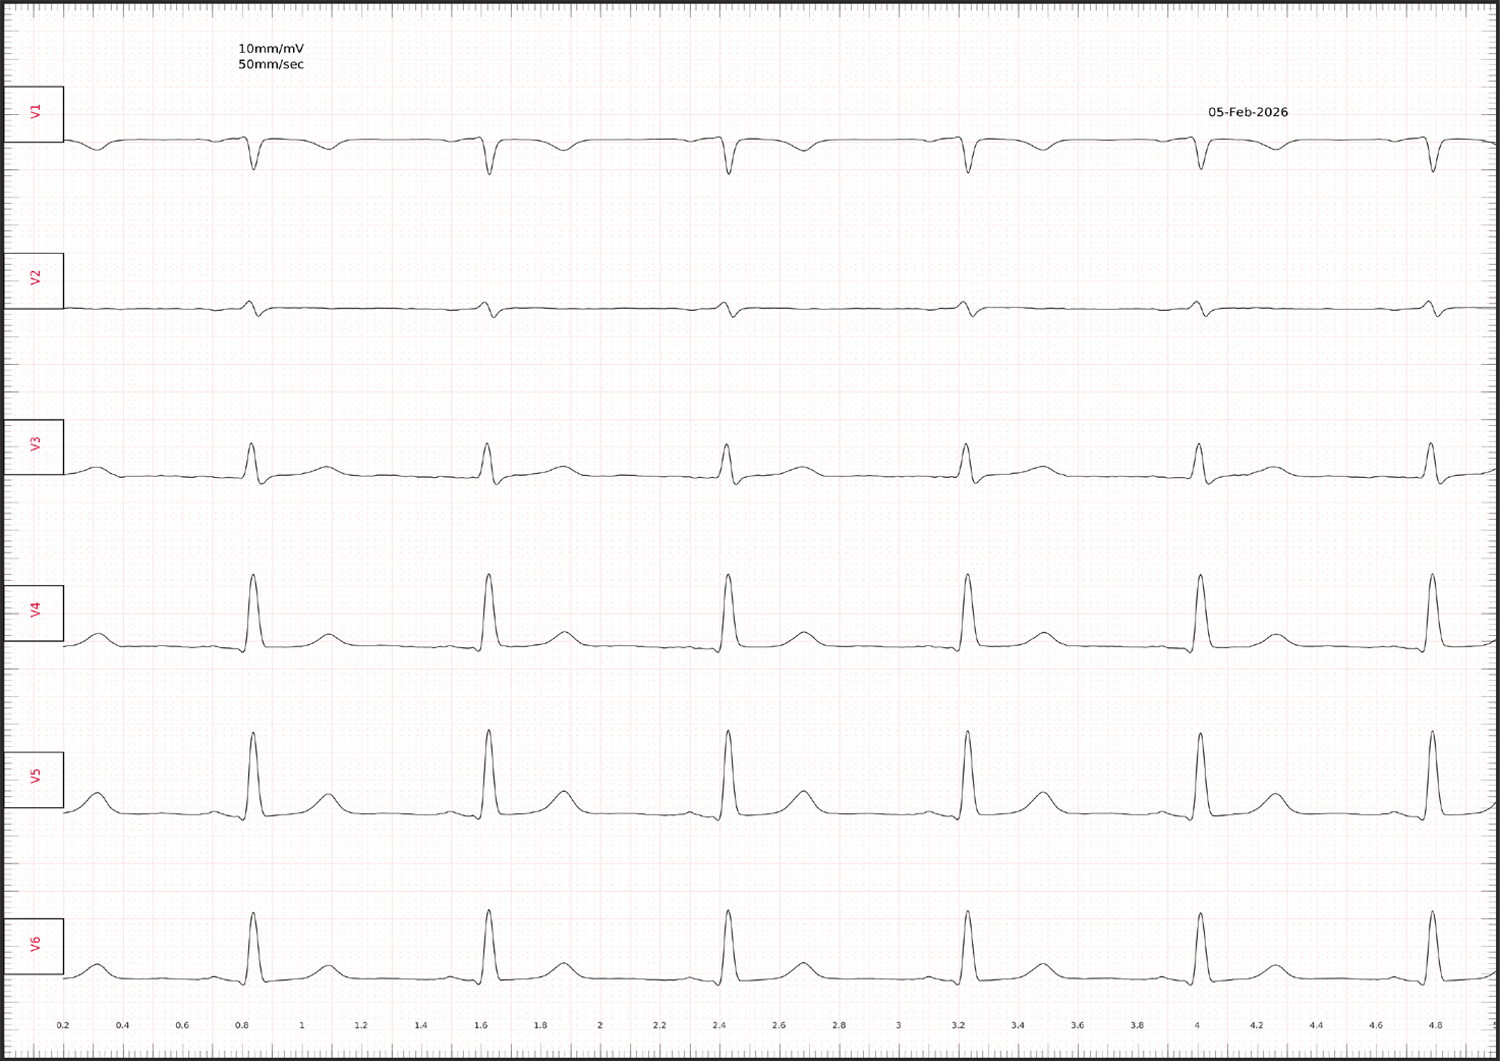
ECG and Rhythm Analysis
This section displays the conventional 12-lead ECG, along with the extended leads V7-V9 and Vr3-Vr6, in accordance with ESC guidelines. In these extended leads, ST elevations can be made visible in addition to the 12-lead, allowing for more confident diagnosis of infarctions.

Interpretation
Here, all three determined factors are presented and summarized based on their abnormalities. From this, a pathology can be derived for all three factors, enabling the initiation of further diagnostic and therapeutic measures.